Water Supply Outlook and Status
Interstate Commission on the Potomac River Basin
What is the Outlook?
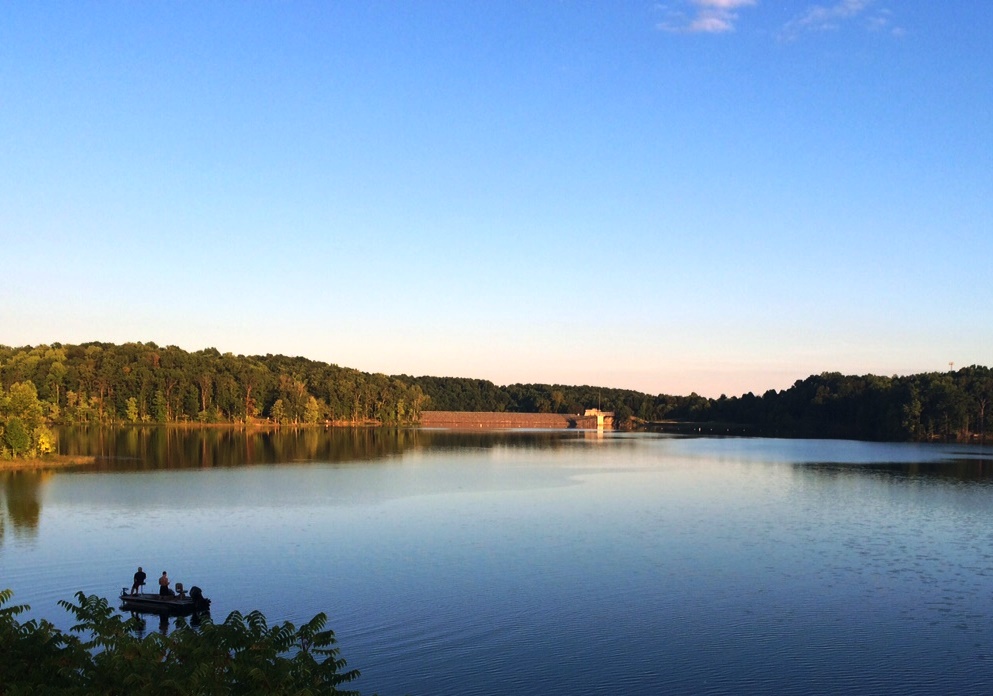
Little Seneca Reservoir
ICPRB’s Section for Cooperative Water Supply Operations on the Potomac (CO-OP) was established to serve as a cooperative technical center on water resources in the Potomac basin. CO-OP staff publish the Water Supply Outlook on a monthly basis between April and October of each year. It provides an update on the possibility of water supply releases from the area’s reservoirs based on long-term precipitation data, flows, and other information for the Potomac basin.
Download: Water Supply Outlook – April 2024
The monthly Water Supply Outlook has returned to its normal schedule for 2024. The next report will be released in May.
Summary/Conclusions
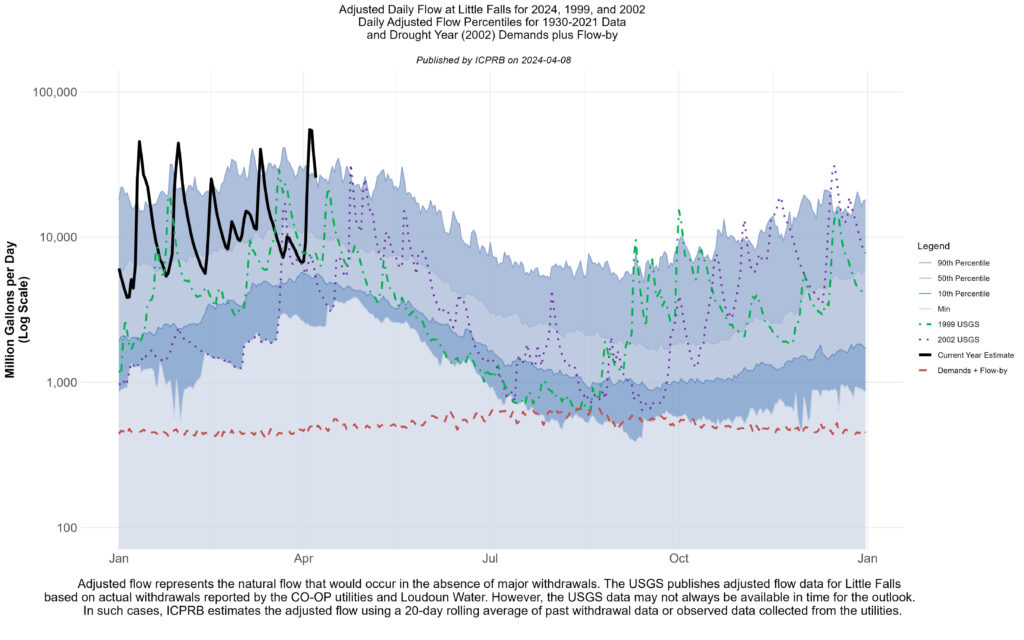
The probability of releases from backup water supply reservoirs in the Washington metropolitan area during the summer and fall seasons of 2024 is currently below normal. The use of Jennings Randolph and Little Seneca reservoirs is generally triggered by low flows brought about by a combination of low summer precipitation and low groundwater levels. Streamflow is currently above normal, and groundwater levels are mostly above normal. The Potomac basin upstream of Washington, D.C. received 3.2 inches of precipitation for the month of March, which is 0.3 inches below normal. After an extended dry period from spring to fall 2023, precipitation has been near-normal to above normal for the past few months. As of March 31, the 12-month cumulative basin precipitation was 3.8 inches below normal. Rainfall in the first week of April has been much above normal. The Middle Atlantic River Forecast Center (MARFC) anticipates no water supply shortages within the Mid-Atlantic region over the next couple of months, assuming continuation of near normal precipitation. At present, there is sufficient flow in the Potomac River to meet the Washington metropolitan area’s water demands without releases from upstream reservoirs. If low-flow conditions develop, the Washington metropolitan area is protected from a water supply shortage owing to carefully designed drought-contingency plans.
Drought Status:
- US Drought Monitor
- CO-OP Drought Monitoring Updates (link updated July 2022)
- Maryland Drought Status
- Virginia Drought Status
- West Virginia Drought Monitor
- Pennsylvania Drought Status
- Forecasted U.S. Conditions Summary
Recent precipitation and forecasts:
- CO-OP’s Potomac Basin Precipitation Map
- Precipitation maps from the MARFC
- Quantitative Precipitation Forecast, MARFC 3 days
- Quantitative Precipitation Forecast, NWS 1-5 days
Groundwater Conditions:
Water Supply Outlook Archive:
2024: April
2023: April | May | June | July | August | September | October | November* | December*
2022: April | May | June | July | August | September | October
2021: April | May | June | July | August | September | October
2020: April | May | June | July | August | September | October
2019: April | May | June | July | August | September | October
2018: April | May | June | July | August | September | October
2017: April | May | June | July | August | September | October
2016: April | May | June | July | August | September | October
2015: April | May | June | July | August | September | October
2014: October
*Due to the persistent dry conditions, the publication period for the Water Supply Outlook was extended.
Please contact us if you would like to be notified when new Water Supply Outlooks are posted.