“Chessie BIBI” Index for Streams
Interstate Commission on the Potomac River Basin
***Updated on February 14, 2023: The newest Chessie BIBI Report shows an improvement in stream health across the Chesapeake Bay watershed. Read more about it in our PRESS RELEASE: Good News for the Bay.***
Read the most recent Stream Biological Health in the Chesapeake Bay Watershed report here.
Measuring Stream Health

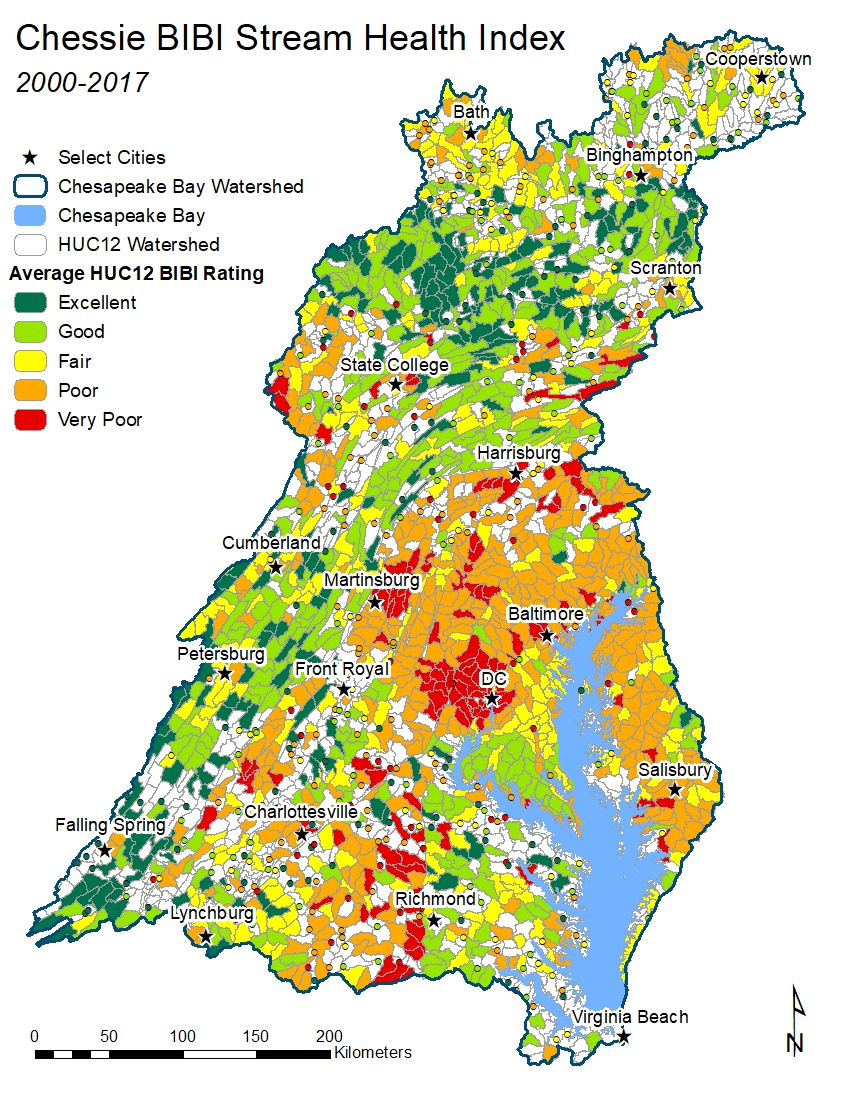
Chessie BIBI status in Chesapeake Bay watershed (2000 – 2017)
The Chesapeake basin-wide index of biotic integrity for stream macroinvertebrates, or “Chessie BIBI,” is a multi-metric index of biological health for freshwater streams and small, wadeable rivers in the Chesapeake Bay watershed. It is composed of family-level macroinvertebrate metrics (indicators) that discriminate strongly between high quality and degraded stream conditions in each of the twelve bioregions in the watershed.
Data from over 25,000 macroinvertebrate samples collected and counted by state, federal, and local agencies, and citizen groups were merged into a common database structure, normalized, and used to develop the index. Crucial to the index’s success was the involvement of several technical advisory groups comprised of regional experts and resource managers.
The index was inspired by the Potomac BIBI and conceptualized in a 2008 Chesapeake pilot study. With Chesapeake Bay Program (CBP) support, the Chessie BIBI index was created in 2011 and substantially refined in 2017. The refined index was then applied to new data and the results were published in the most recent report.
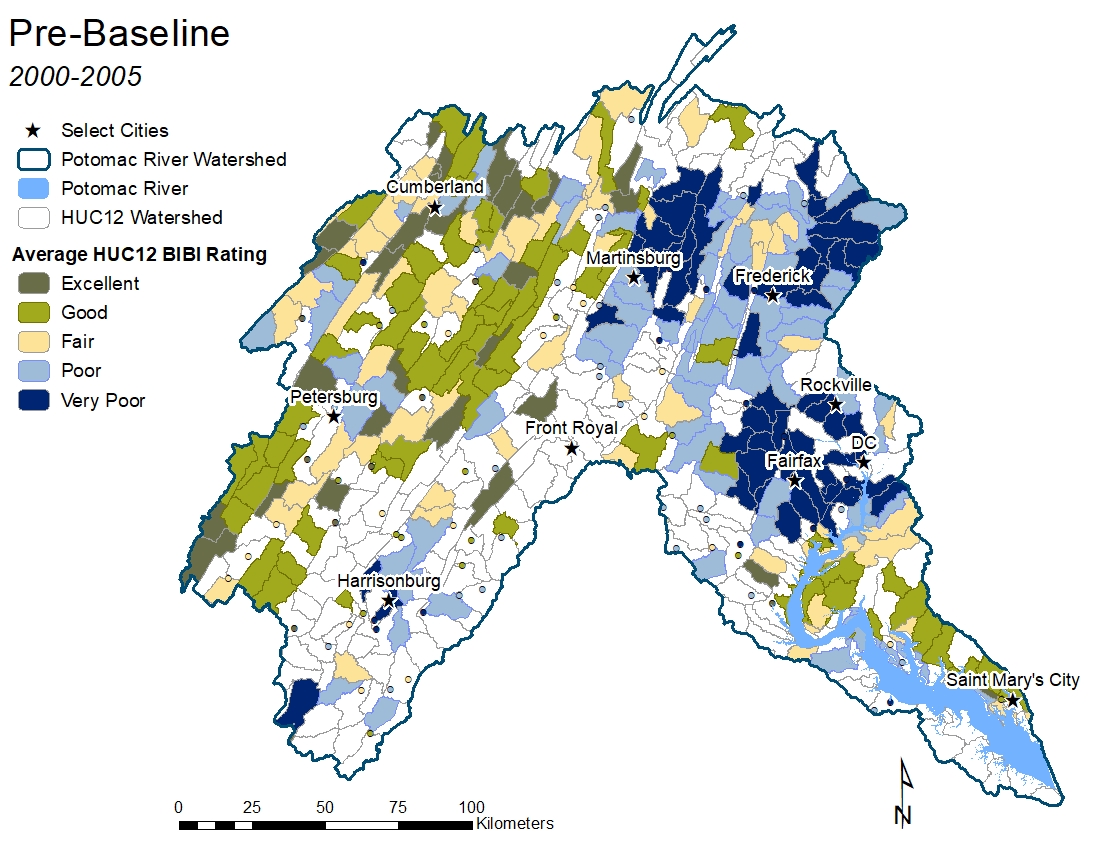
The Chessie BIBI map shows the family-level, bioregion-scaled Chessie BIBI results by HUC12-bioregion spatial unit for the Chesapeake Bay watershed from 2000 through 2017. A colored HUC12-bioregion unit has two or more sampling locations and the color reflects the average result. A colored dot indicates only one sampling location occurred in the unit. The unsampled units are left blank (white).
Click here to explore the interactive map of the Chessie BIBI Stream Health Index.
Developing the Index
A suite of macroinvertebrate metrics was calculated for each sample and samples were classified into one of five disturbance categories based on habitat and water quality conditions at the sampling site. Disturbance categories ranged from Reference (best quality) to Severely Degraded (poorest quality). Values of the macroinvertebrate metrics at Reference sites were then used as benchmarks against which other sites were scored.
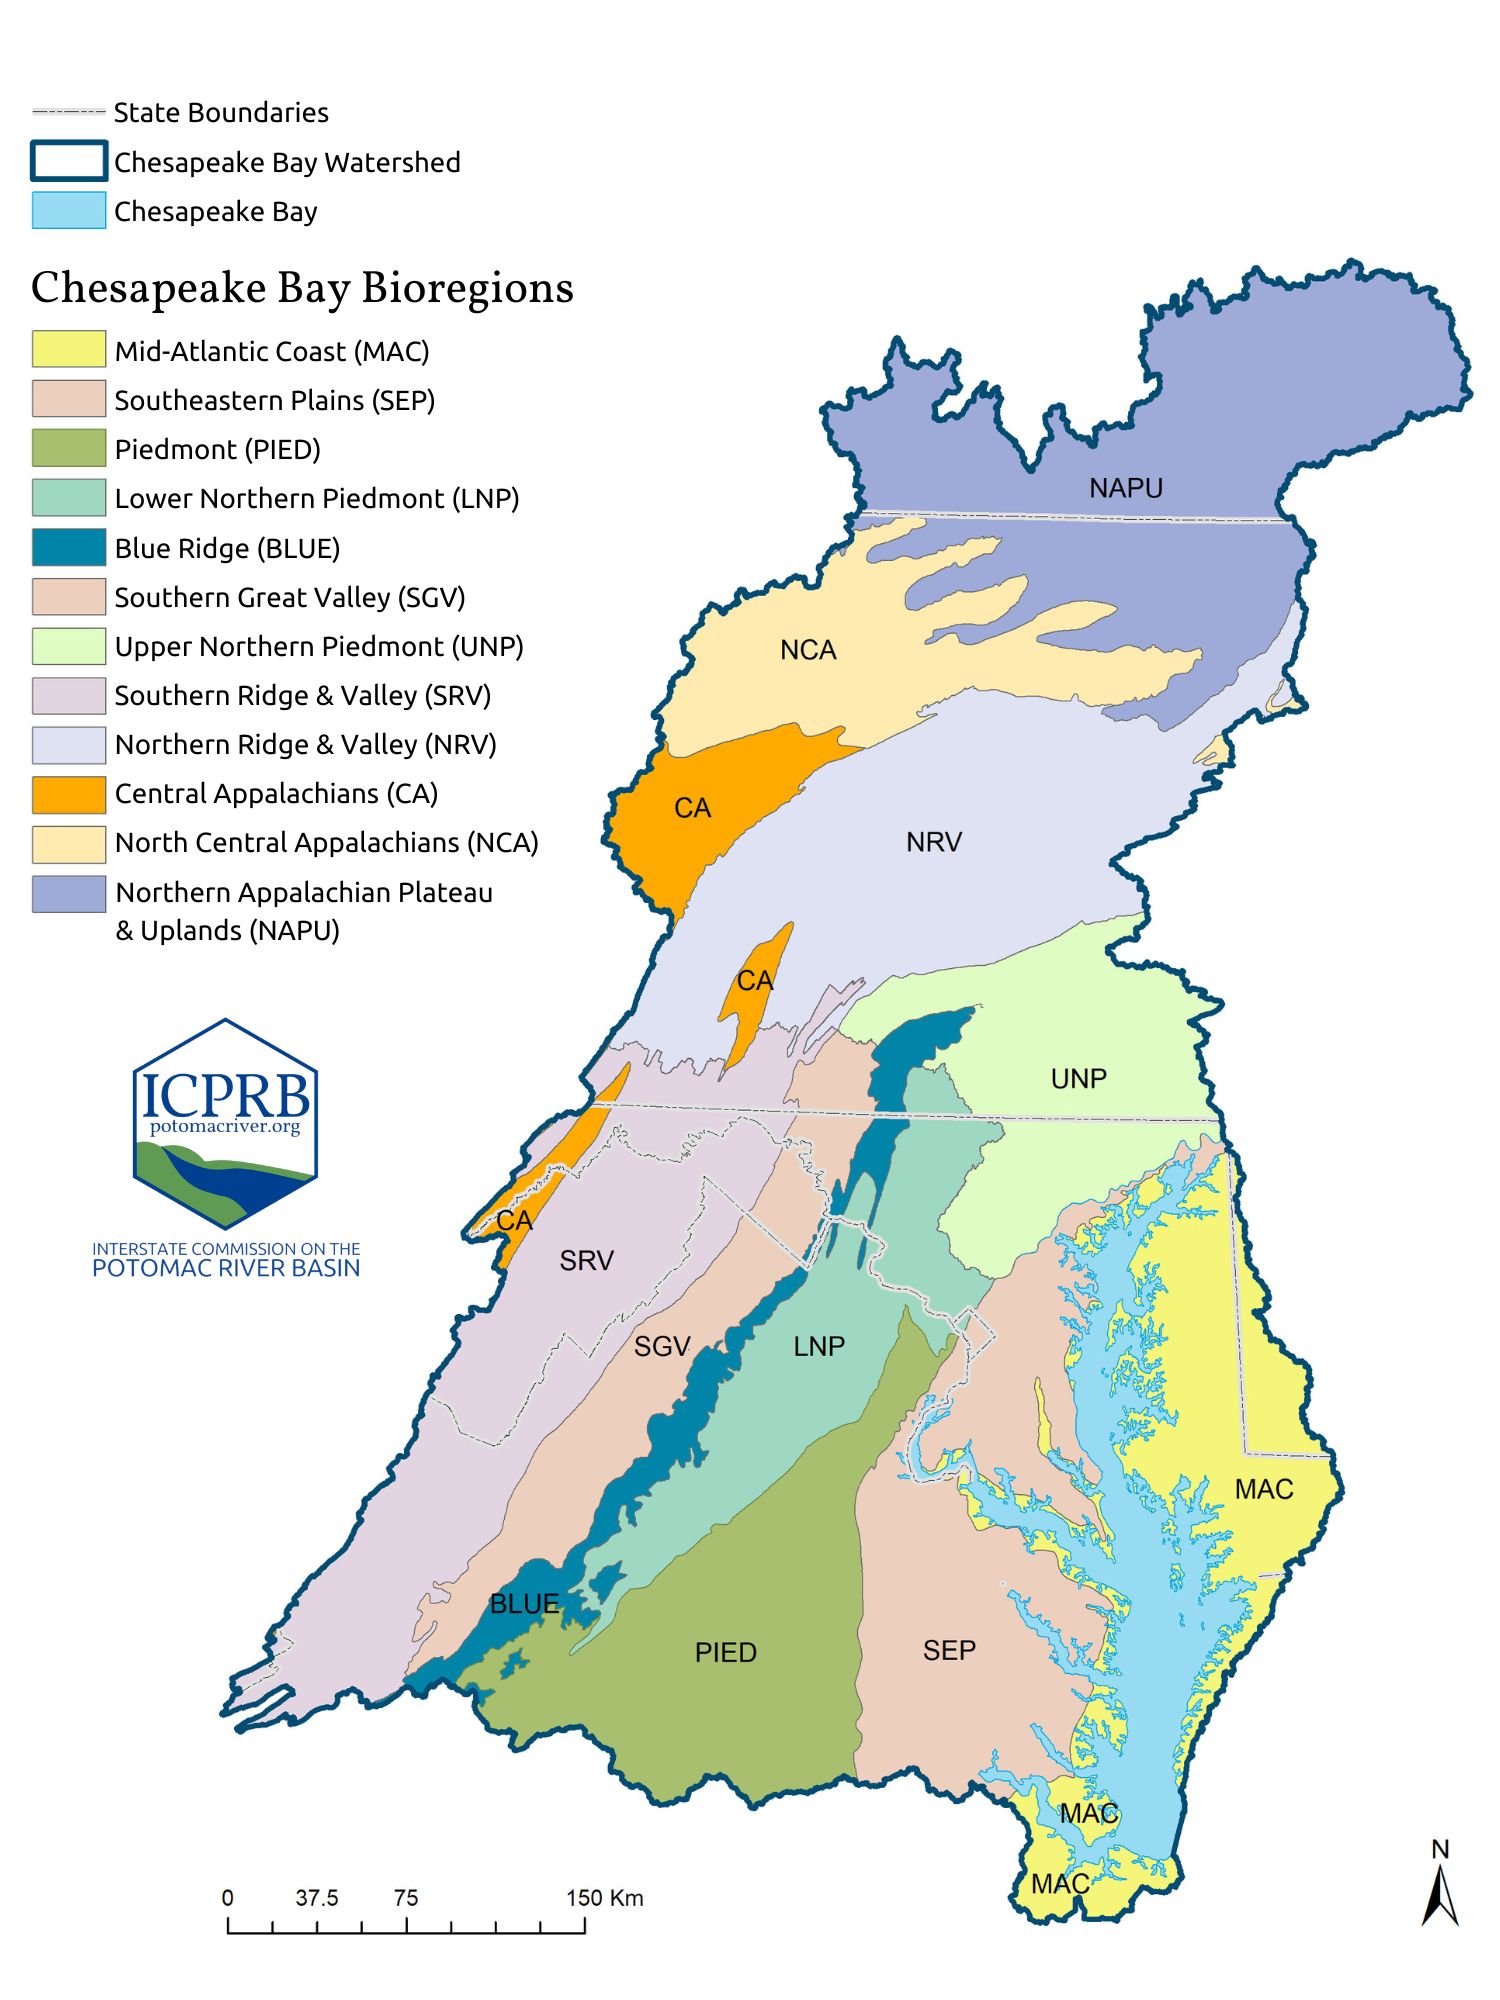
Bioregions in the Chesapeake Bay Watershed
In the 2017 index refinement, eight possible constructs for selecting and scoring metrics for the index were examined. The most discriminatory metrics representing key attributes of the community (composition, richness/diversity, pollution tolerance, habit, feeding group) were systematically selected for the index. Bioregion and regional (Inland, Coast) spatial scales for calculating index were investigated. Metrics keyed to order-, family-, or genus-level attributes were also used to build versions of the index for different taxonomic resolutions of the raw counts. Order-level metrics are less sensitive, but they do not require laboratory enumeration and are suited for rapid screening in the field. Family-level metrics generally performed well, and bioregion indices built from scored family-level metrics had classification efficiencies between 70.4% and 90.0%. Bioregion indices built from genus-level metrics performed marginally better than family-level indices in some but not all bioregions.
Click here to explore the interactive map of the Bioregions in the Chesapeake Bay.
A common scale of five narrative ratings was applied to the index scores of each taxonomic and spatial version of the Chessie BIBI index. The 50th, 25th, and 10th percentiles of each version’s index scores in Reference conditions were used to define Excellent, Good, Fair, and Poor macroinvertebrate status. A fifth rating, Very Poor, was defined by half the value of the 10th percentile. Ratings from the same taxonomic and spatial version of the index are directly comparable (e.g., family-level bioregion index) and can be used to estimate percentages of stream in healthy condition across the Chesapeake watershed.
Databases and Analysis Tools
In 2019 and 2020, ICPRB and CBP updated the 2017 dataset with additional data and produced a Chessie BIBI package containing the R-scripts, shape files, spreadsheets, and documentation needed to calculate a suite of metrics and the family-level, bioregion-specific Chessie BIBI from merged datasets of raw macroinvertebrate counts. Custom R-scripts were run through the open source Rstudio program. The raw data, calculated metrics, and BIBI package are available in the online archive.
- Databases of macroinvertebrate raw counts, habitat scores, and water quality field measurements (v.3.01)
- Macroinvertebrate metrics
- Chessie BIBI index scores and ratings
- Chessie BIBI package of analysis tools
Database Versions: As demonstrated in the Chessie BIBI package, repeated runs of the program can produce slightly different index scores and ratings. This is due to the random selection of rare individuals in each program run as a sample is reduced to 100 individuals (rarefaction) in the data normalization step. Minor modifications made in 2019 to the habit assignments of a few macroinvertebrate taxa also changed the index scores and ratings at several stations. The scores and ratings used in the 2017 refinement version are called Version 2.0. Those calculated with the 2019 program from the same raw data are called Version 2.01. The updated database constructed in 2021 is Version 3.01.
Creating a Management Tool
A 2014 goal of the Chesapeake Bay Watershed Agreement calls for improving stream health and function in ten percent of stream miles above a “2008 baseline” for the Chesapeake basin. Biological communities are considered the definitive measure of stream health, and CBP selected the Chessie BIBI as its initial indicator of stream health.
Turning the Chessie BIBI index into an effective management tool to track progress requires decisions on when and how to use it. At a 2018 workshop, scientists and managers agreed to measure stream health in the Chesapeake watershed with the family-level bioregion Chessie BIBI. They selected the 6-year period between 2006 and 2011 as the most practical “2008 baseline” because it overlaps all the state rotational sampling designs. For more information, visit ICPRB’s CBP Stream Health Outcome webpage.
Timeline
The graphic below illustrates the Chessie BIBI timeline, from the proof-of-concept analysis in 2008 to full-fledged indicator available online in 2021. Along the way, analyses have demonstrated the sensitivity of individual macroinvertebrate metrics to bioregion and of the Chessie BIBI index to stream nutrient concentration, flow alteration (Middle Potomac, Chesapeake Bay watershed), landscape features, urban stormwater management, and climate change.
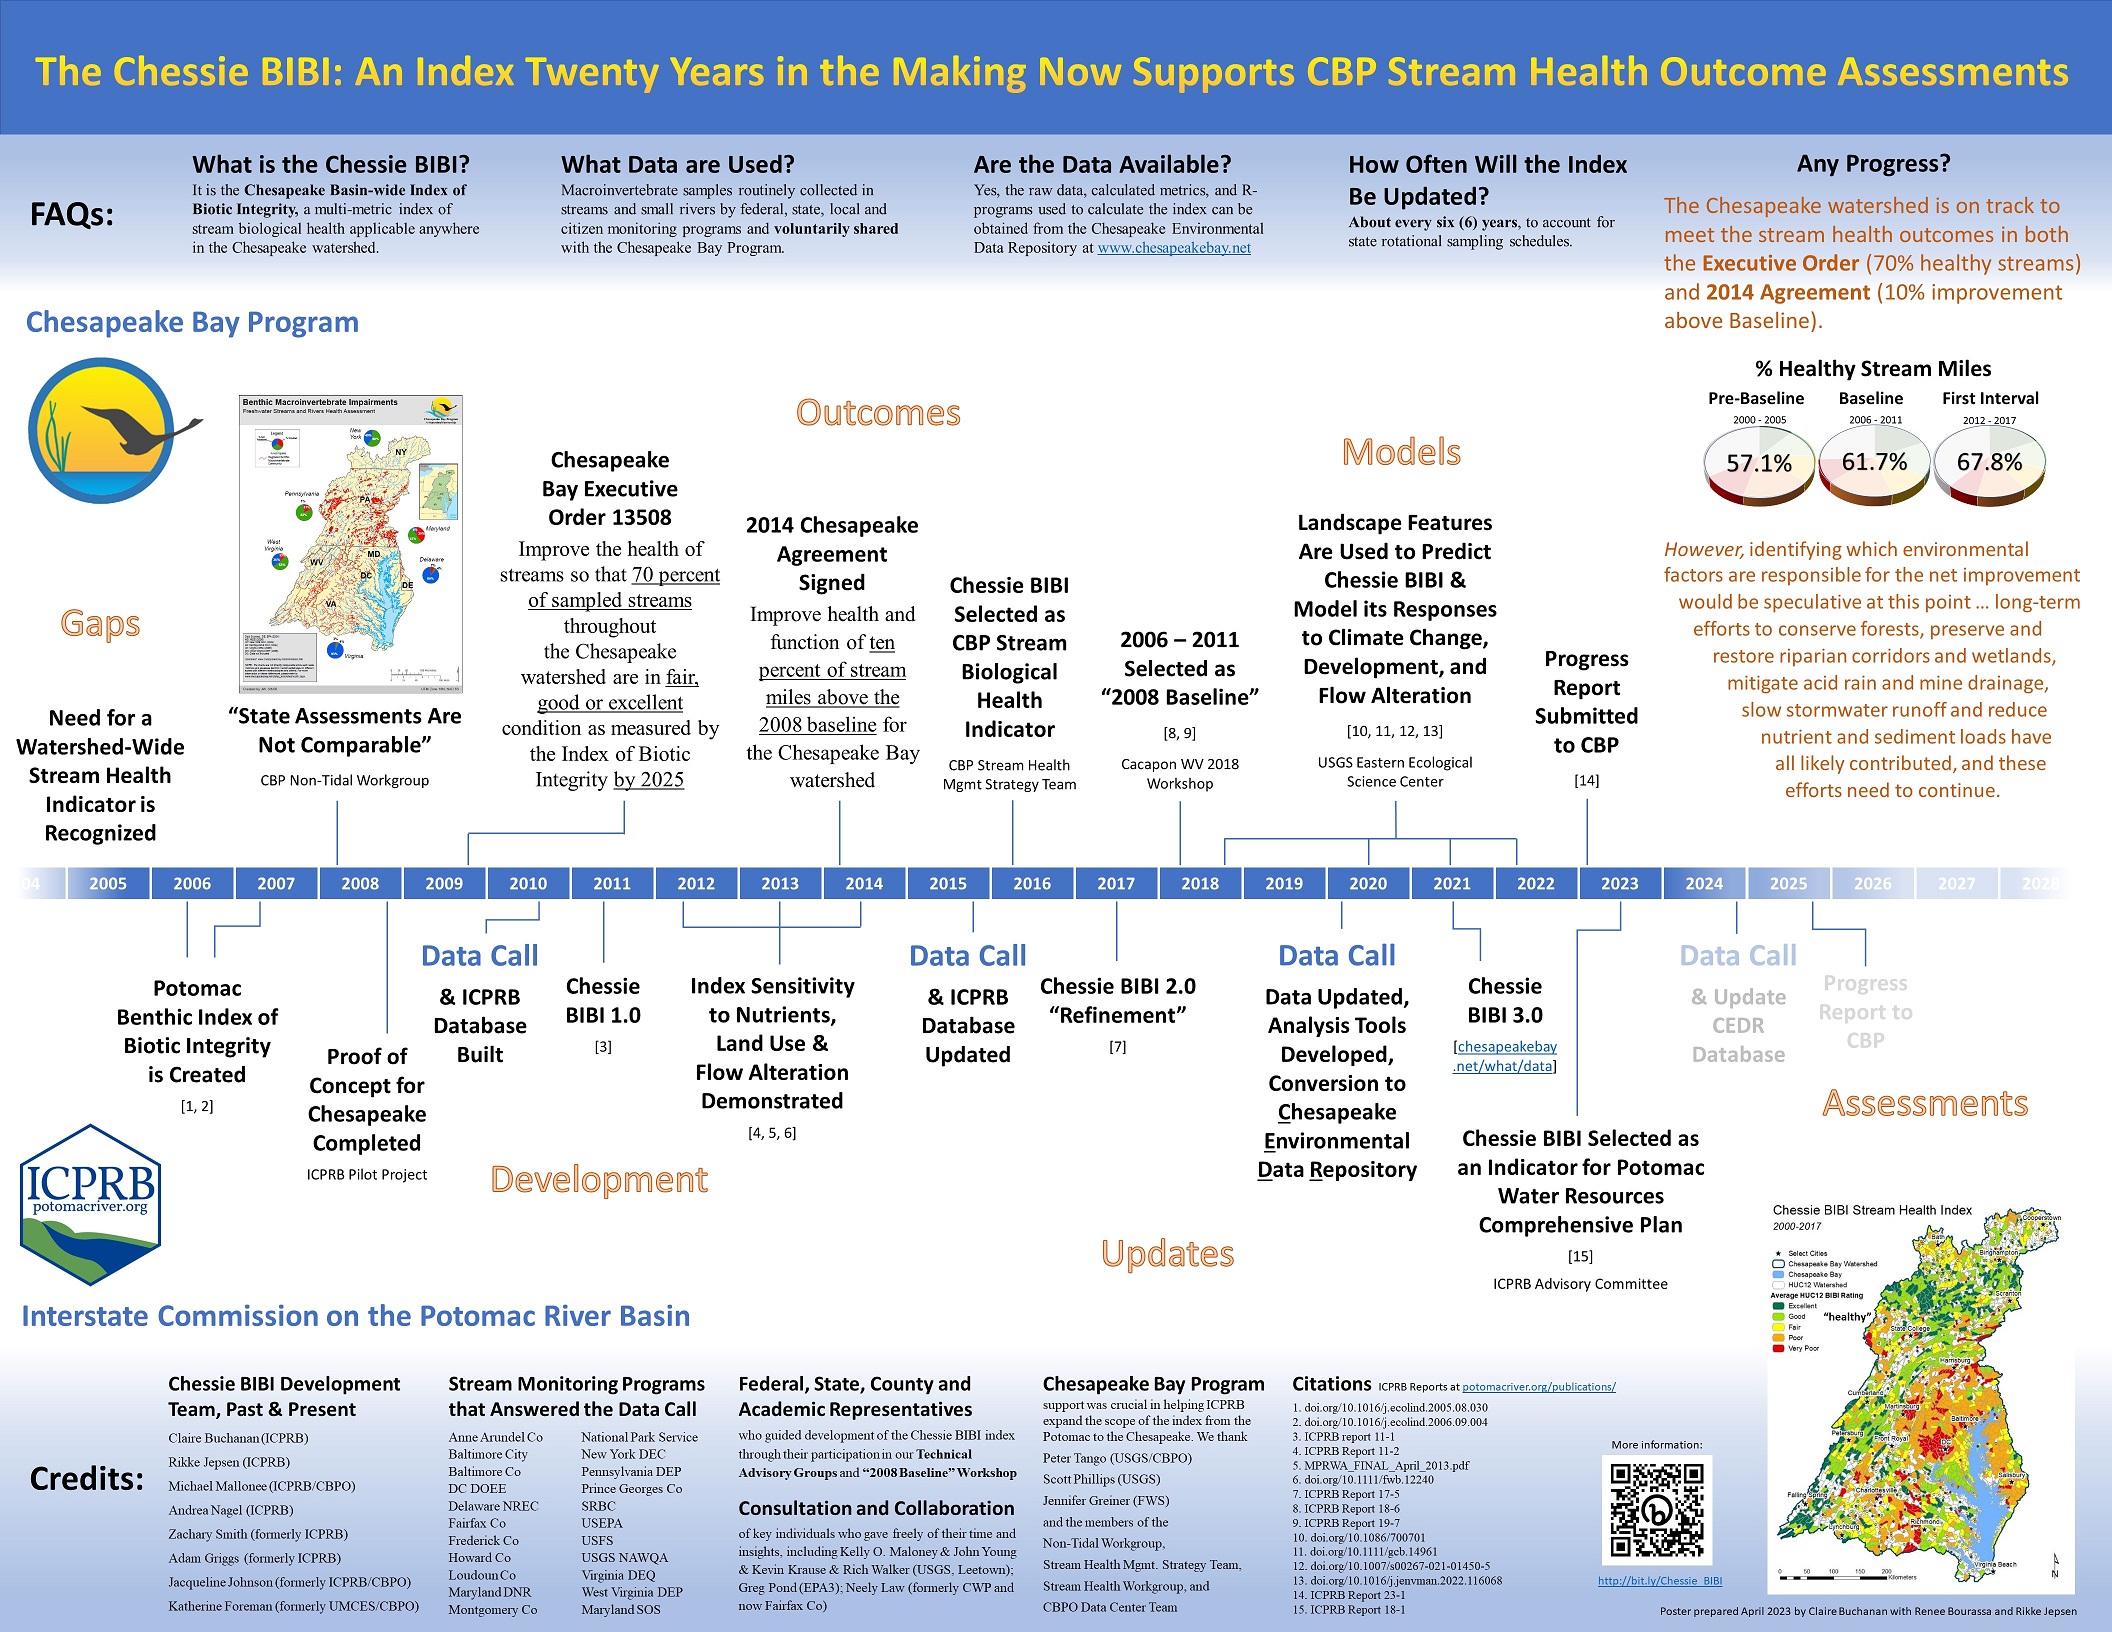
Timeline of Chessie BIBI Development.
Stream Health in the Potomac and Chesapeake
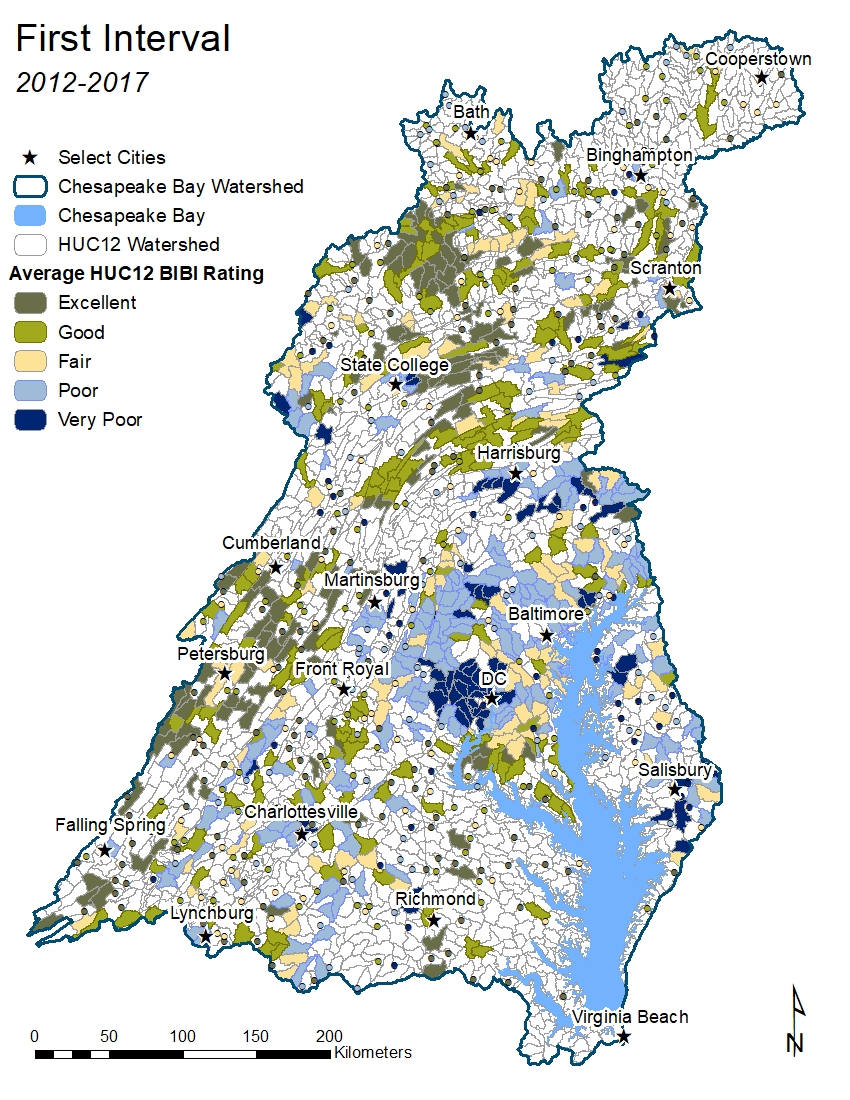
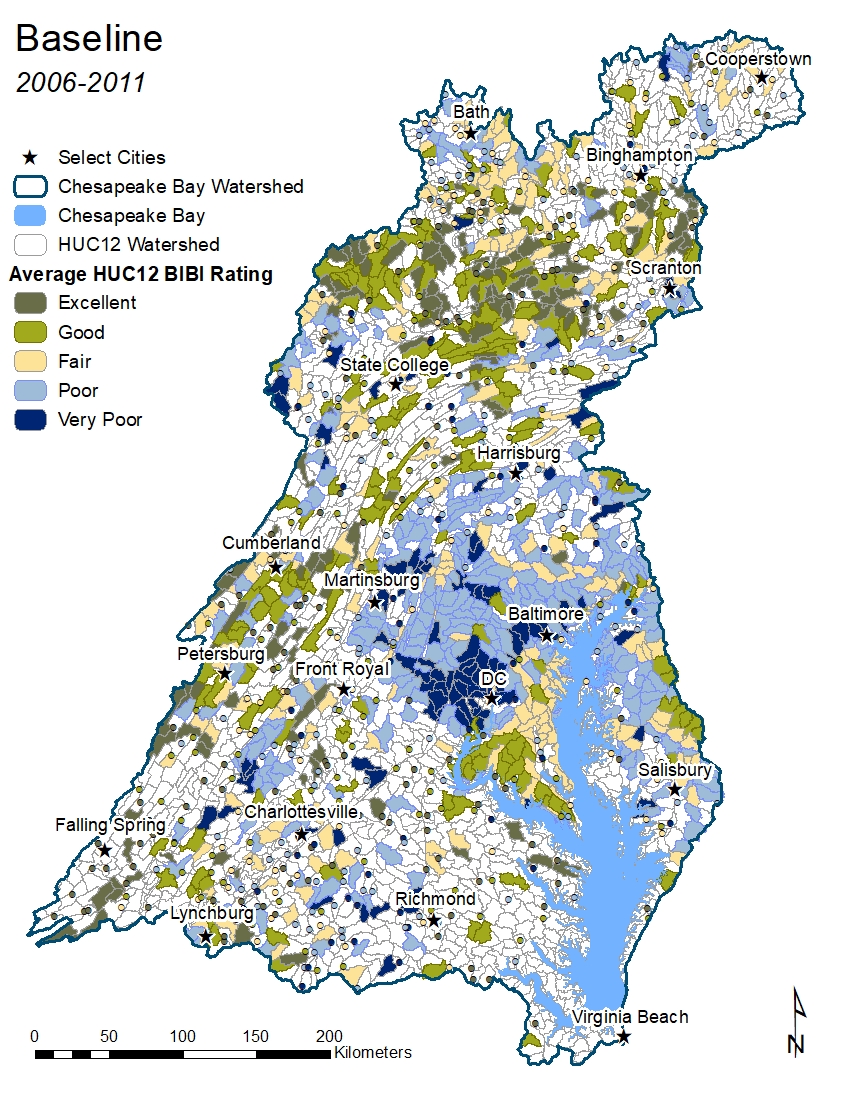
With more data added to the database in 2019, the baseline (2006 – 2011) can now be compared to the previous Pre-Baseline (2000 – 2005) and subsequent First Interval (2012 – 2017) 6-year periods. Another data call is planned for late 2024 (see Timeline above) and will provide an additional six-year analysis for the Second Interval (2018 – 2023).
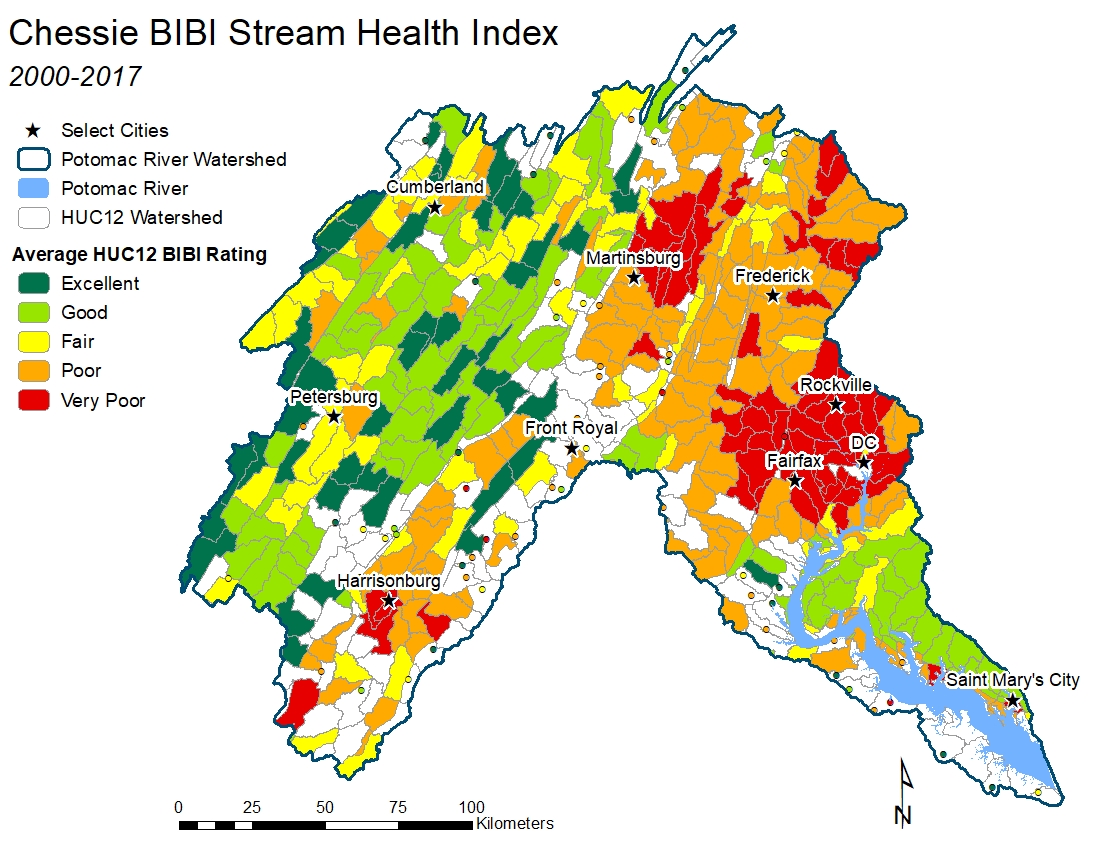
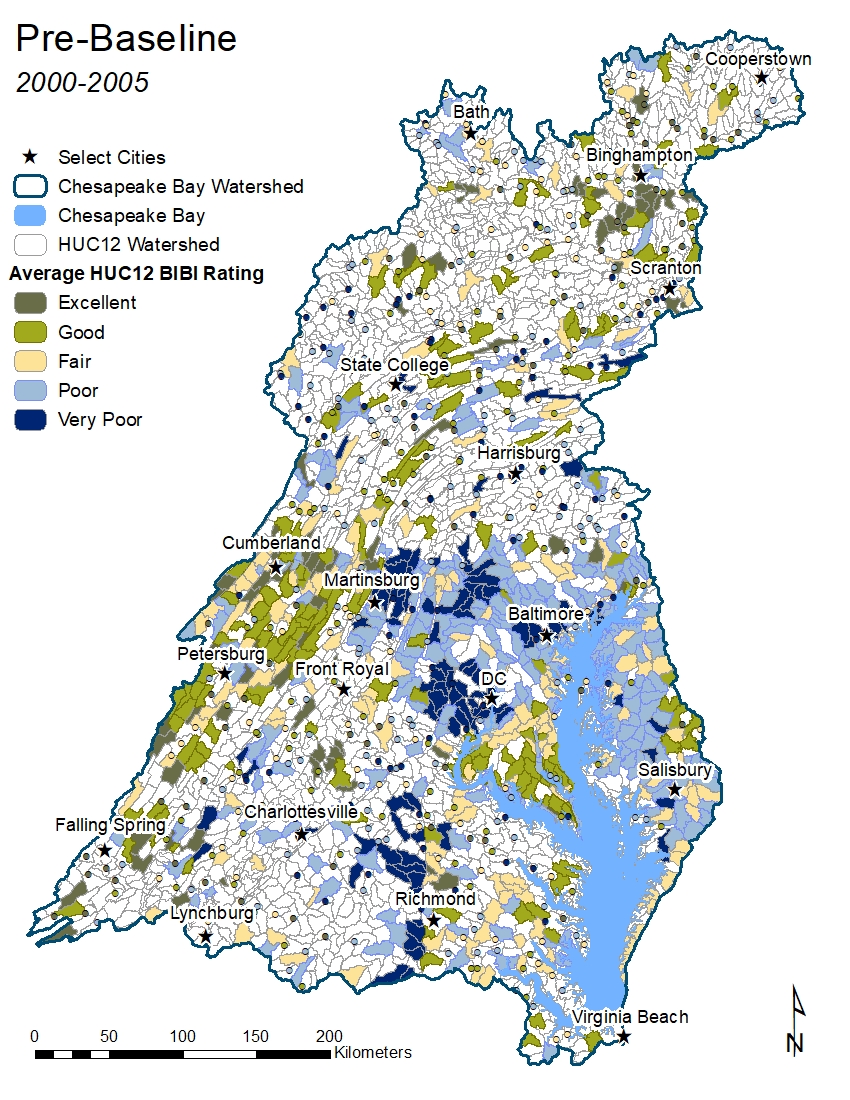
The maps below feature the Chesapeake watershed and the Potomac watershed for the three periods of interest to CBP. Again, HUC12-bioregion units with two or more sampling locations are colored-in, units with one sampling location are represented by a dot, and unsampled units are blank (white).
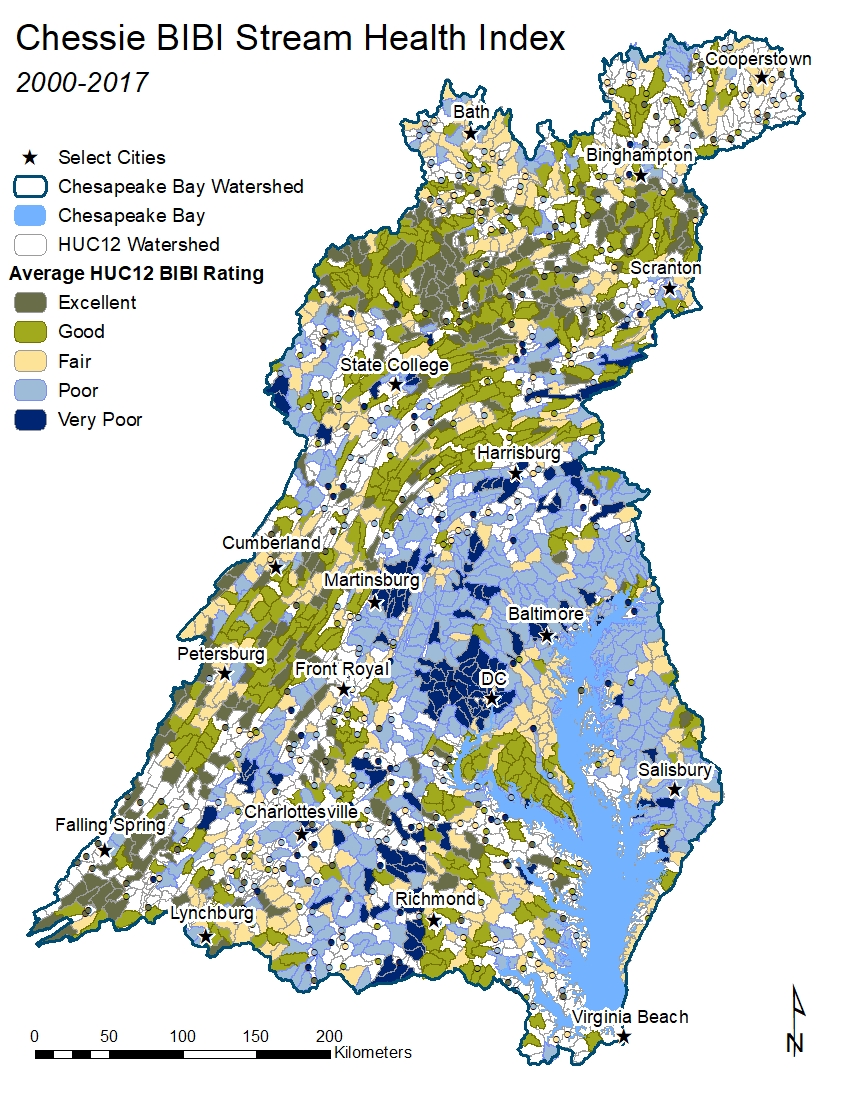
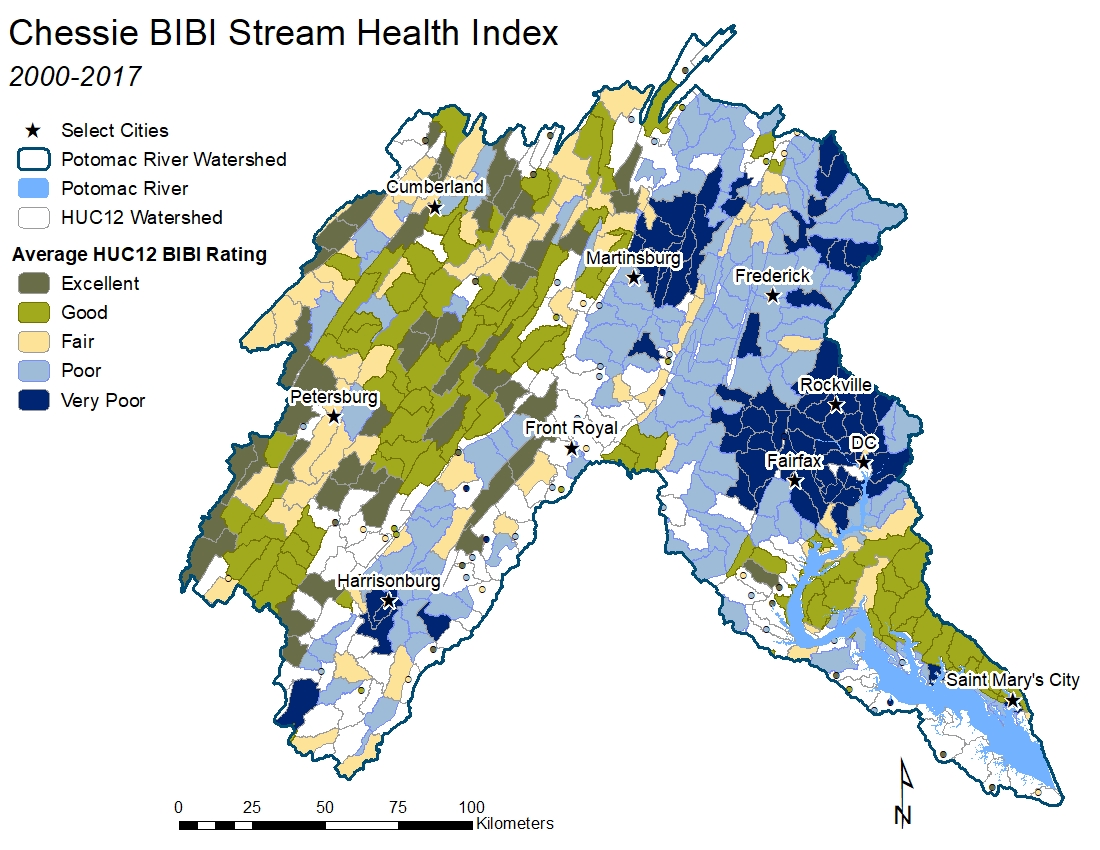
Maps with higher color contrast can be found at the bottom of this page.
Chesapeake Watershed Maps
 Pre-Baseline of the Chessie BIBI Map (2000-2005)


Stream health in the Chesapeake Bay watershed for the pre-baseline, baseline, and first interval periods.
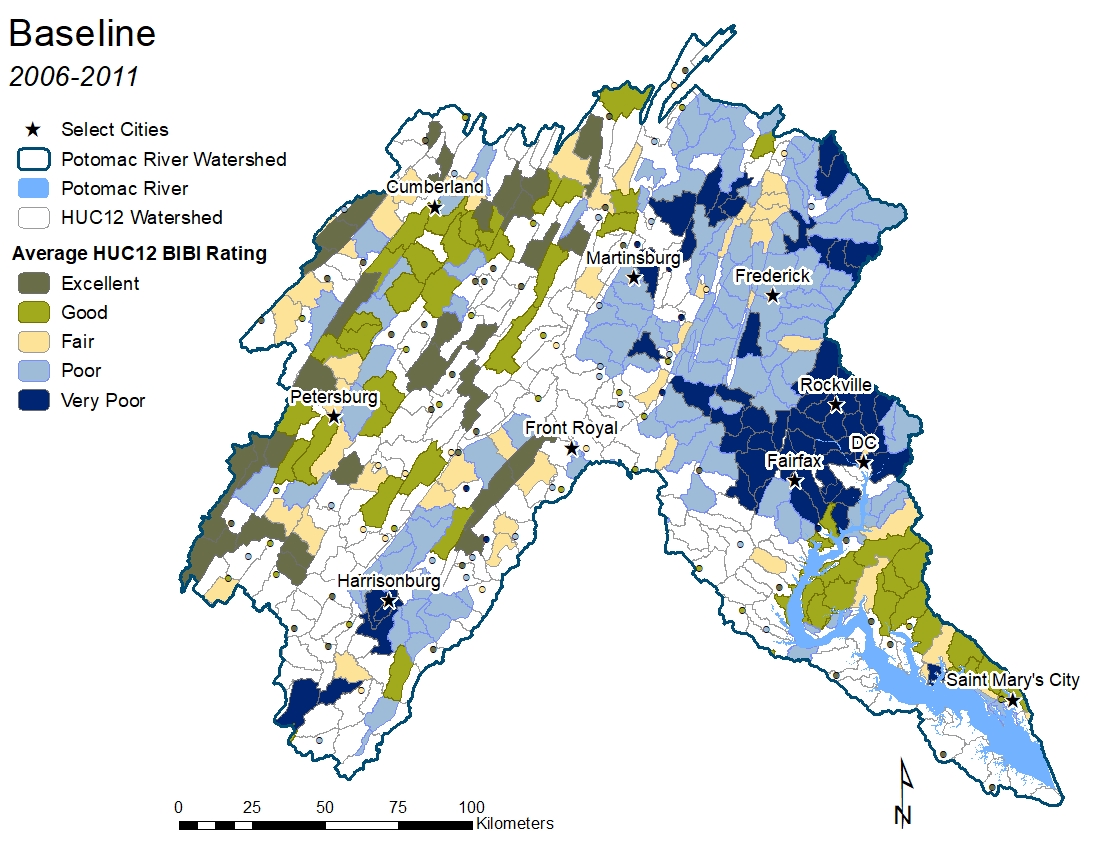
Potomac Watershed Maps
- Pre-Baseline of the Potomac River Watershed (2000-2005)


Stream health in the Potomac River watershed for the pre-baseline, baseline, and first interval periods.
Monitoring results can also be area-weighted and “rolled up” to the scale of larger watersheds (such as the Potomac or the entire Chesapeake Bay watershed) to obtain estimates of how much of that watershed’s area is supporting healthy stream macroinvertebrate populations. Populations with Chessie BIBI ratings of “excellent,” “good,” and “fair” are considered healthy because these ratings encompass 90% of index scores in the bioregional Reference populations. Populations with Chessie BIBI ratings of “poor” and “very poor” are considered degraded.
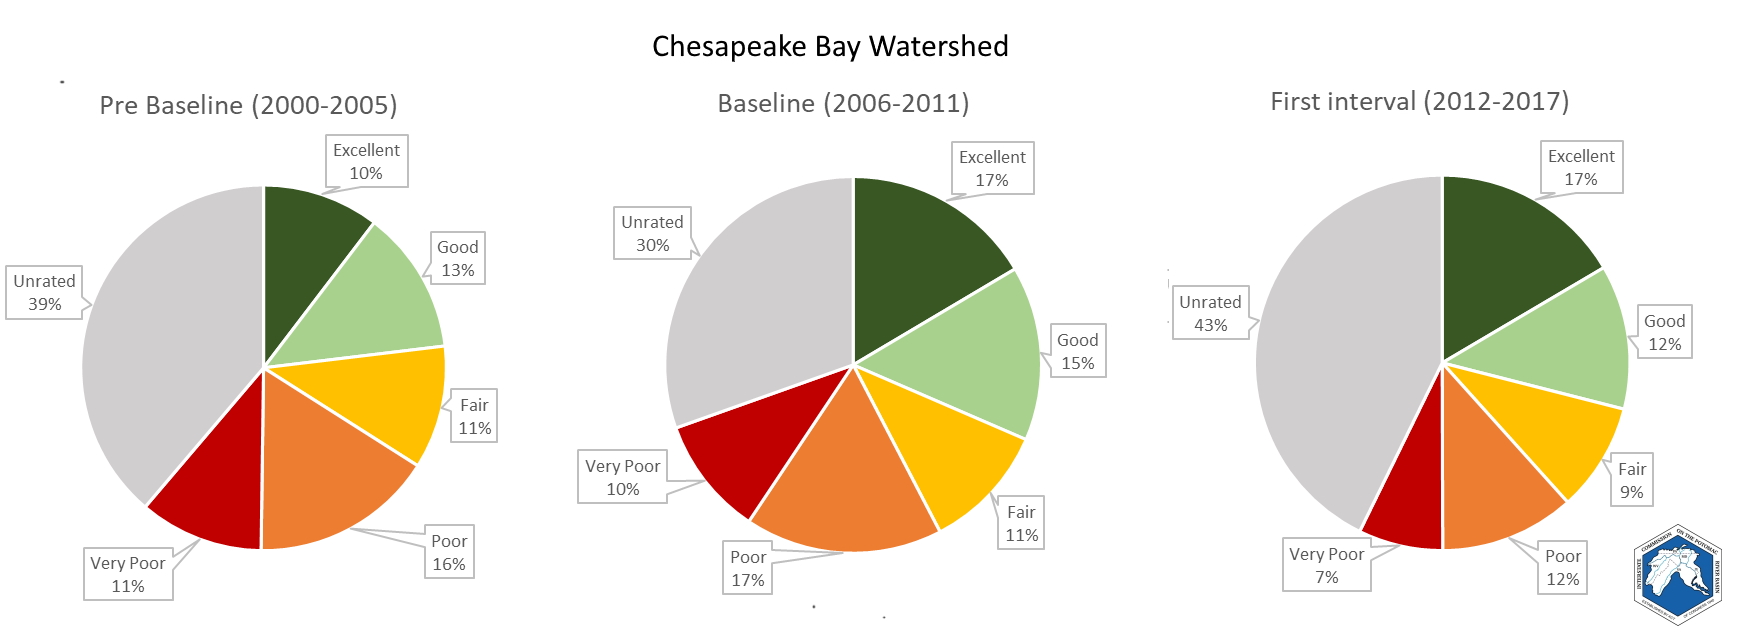
Area-weighted percentages of Chessie BIBI ratings in the Chesapeake Bay watershed.
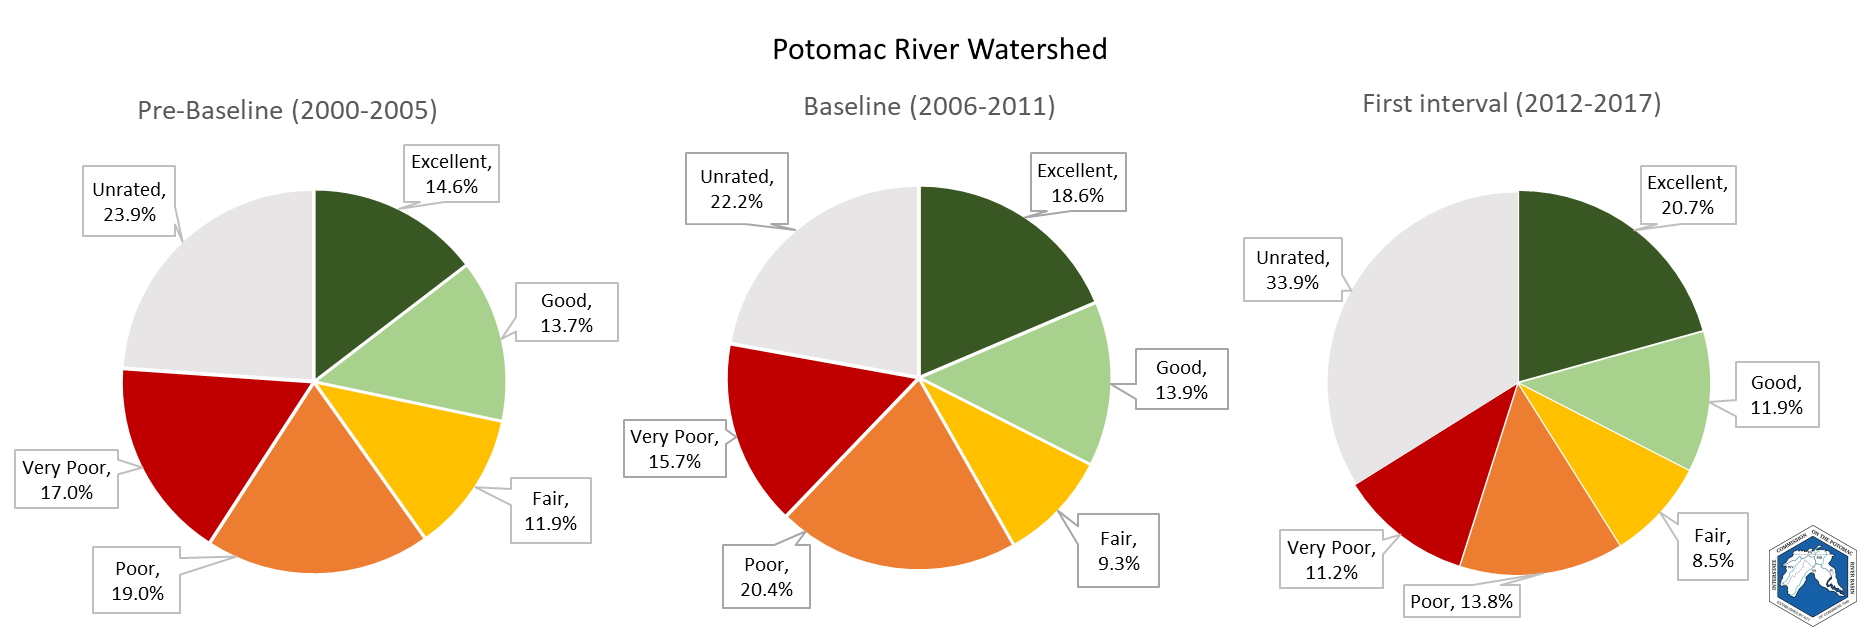
Area-weighted percentages of Chessie BIBI ratings in the Potomac River watershed.
Relatively large portions of both the Chesapeake Bay and Potomac watersheds are unsampled in each of the three 6-year intervals and therefore unrated, making it hard to obtain reliable estimates of overall stream health for each period. A better understanding of stream health in the Chesapeake Bay and Potomac watersheds can be gained when results from the three intervals are combined.
 Chessie BIBI for the Chesapeake Bay Watershed (2000-2017) |
 Chessie BIBI for the Potomac River Watershed (2000-2017) |
Statistical analyses presented in a 2023 ICPRB report indicate about 61.0% of the Chesapeake’s watershed area likely supported macroinvertebrate communities with BIBI ratings of excellent, good, and fair in the baseline period. The percentage increased to 67.1% in the first interval. The 6% net improvement suggests the collective impact of multiple environmental stressors on streams may be slowly lessening in many parts of the watershed. Metrics for a variety of environmental stressors are currently being explored and will help future investigations of stream macroinvertebrate responses to those stressors. They can help explain the current trend.
Read the most recent Stream Biological Health in the Chesapeake Bay Watershed report here.
Interactive Map of Chessie BIBI
An interactive map is available for exploration of regional areas and a deeper dive into each stream health index.
Model-Based Predictions
A random forest model has been developed to predict Chessie BIBI ratings in unsampled stream catchments for both the baseline period and the period from 2000 to 2019. Predictor variables were spatial coordinates, bioregion, soil, and concurrent landscape features including land cover, precipitation, and number of dams. Between 2000 and 2019, very few of the predicted Chessie BIBI ratings in the 95,867 modeled catchments shifted substantially. When the results are area-weight, streams in an estimated 0.09% of the Chesapeake Bay watershed shifted from healthy to degraded conditions and those in an estimated 0.10% shifted from degraded to healthy conditions. As of 2019, degraded ratings were predicted in 25.10% of the watershed area and healthy ratings in 59.68%, with 6.47% classified as “uncertain” and 8.75% unrated for various reasons. After further testing and refinement of the model, model-predicted ratings could be used to fill gaps in the monitoring coverage for the 6-year intervals of interest to CBP.
High contrast maps:
Maps with higher color contrast ratios for easier visibility are available below.

Reports and Publications
2017 Chessie BIBI
- Buchanan, R. D. Jepsen, and M. E. Mallonee. 2023. Stream Biological Health in the Chesapeake Bay Watershed. ICPRB Report ICP23-1. Report Prepared for the Chesapeake Bay Program Stream Health Workgroup. Available online at: www.potomacriver.org.
- Smith, Z., C. Buchanan, and A. Nagel. 2017. Refinement of the Basin-Wide Index of Biotic Integrity for Non-Tidal Streams and Wadeable Rivers in the Chesapeake Bay Watershed. ICPRB Report 17-2a (report); ICPRB Report 17-2b (appendices).
- Buchanan, C., K. Maloney, Z. Smith, A. Nagel, and J. Young. 2018. Creating a stream health baseline for the Chesapeake basin from monitoring and model data. ICPRB report 19-7.
- Maloney, K. O., Z. M. Smith, C. Buchanan, A. Nagel and J. A. Young. 2019. Predicting biological conditions for small headwater streams in the Chesapeake Bay watershed. https://doi.org/10.1086/700701.
- Maloney, K. O., K. P. Krause, C. Buchanan, L. E. Hay, G. J. McCabe, Z. M. Smith, T. L. Sohl, and J. A. Young. 2020. Disentangling the potential effects of land‐use and climate change on stream conditions. https://doi.org/10.1111/gcb.14961.
- Maloney, K. O., D. M. Carlisle, C. Buchanan, J. L. Rapp, S. H. Austin, M. J. Cashman and J. A. Young. 2021. Linking Altered Flow Regimes to Biological Condition: an Example Using Benthic Macroinvertebrates in Small Streams of the Chesapeake Bay Watershed. https://doi.org/10.1007/s00267-021-01450-5.
- Maloney, K. O., C. Buchanan, R. D. Jepsen, K. P. Krause, M. J. Cashman, B. P. Gressler, J. A. Young, and M. Schmid. 2022. Explainable machine learning improves interpretability in the predictive modeling of biological stream conditions in the Chesapeake Bay Watershed, USA. J. Environmental Management. 322. https://doi.org/10.1016/j.jenvman.2022.116068.
- Jepsen, R., C. Buchanan, A. Nagel, D. Caraco, and L. Fraley-McNeal. 2022. An Analysis of Pooled Monitoring Data in Maryland to Evaluate the Effects of Restoration on Stream Quality in Urbanized Watersheds. Final report to Maryland Department of the Environment. ICPRB Report 22-1.
2011 Chessie BIBI
- Buchanan, C., K. Foreman, J. Johnson, and A. Griggs. 2011. Development of a Basin-wide Benthic Index of Biotic Integrity for Non-tidal Streams and Wadeable Rivers in the Chesapeake Bay Watershed: Final Report to the Chesapeake Bay Program Non-Tidal Water Quality Workgroup. ICPRB Report 11-1.
- Mandel, R., C. Buchanan, A. N. Griggs, A. Nagel, and O. Devereux. 2011. Data Analysis to Support Development of Nutrient Criteria for Maryland Free-Flowing Waters. ICPRB Report 11-2.
- U.S. Army Corps of Engineers, The Nature Conservancy, and Interstate Commission on the Potomac River Basin. 2013. Middle Potomac River Watershed Assessment: Potomac River Sustainable Flow and Water Resources Analysis. ICPRB Report PRC 13-8.
- Buchanan, C., H. Moltz, C. Haywood, J. B. Palmer, and A. N. Griggs. 2013. A test of the Ecological Limits of Hydrologic Alteration (ELOHA) method for determining environmental flows in the Potomac River basin, U.S.A. https://doi.org/10.1111/fwb.12240.
2007 Potomac Index
- Astin, L. 2007. Developing biological indicators from diverse data: The Potomac Basin-wide Index of Benthic Integrity (B-IBI). Ecological Indicators 7(4):895-908. https://doi.org/10.1016/j.ecolind.2006.09.004.
- Astin, L. 2006. Data synthesis and bioindicator development for nontidal streams in the interstate Potomac River Basin, USA. Ecological Indicators 6(4):664-685. https://doi.org/10.1016/j.ecolind.2005.08.030.
Return to Aquatic Life Main Page.