CBP Stream Health Outcome
Interstate Commission on the Potomac River Basin
Creating a Management Tool
The Chesapeake Bay Program (CBP) aims to use the Chessie BIBI to track progress in restoring stream health across the Chesapeake Bay watershed and measure attainment of the Program’s goal for a Stream Health Outcome:
“Continually improve stream health and function throughout the watershed. Improve health and function of ten percent of stream miles above the 2008 baseline for the watershed.”
Click here to learn more about Chessie BIBI.
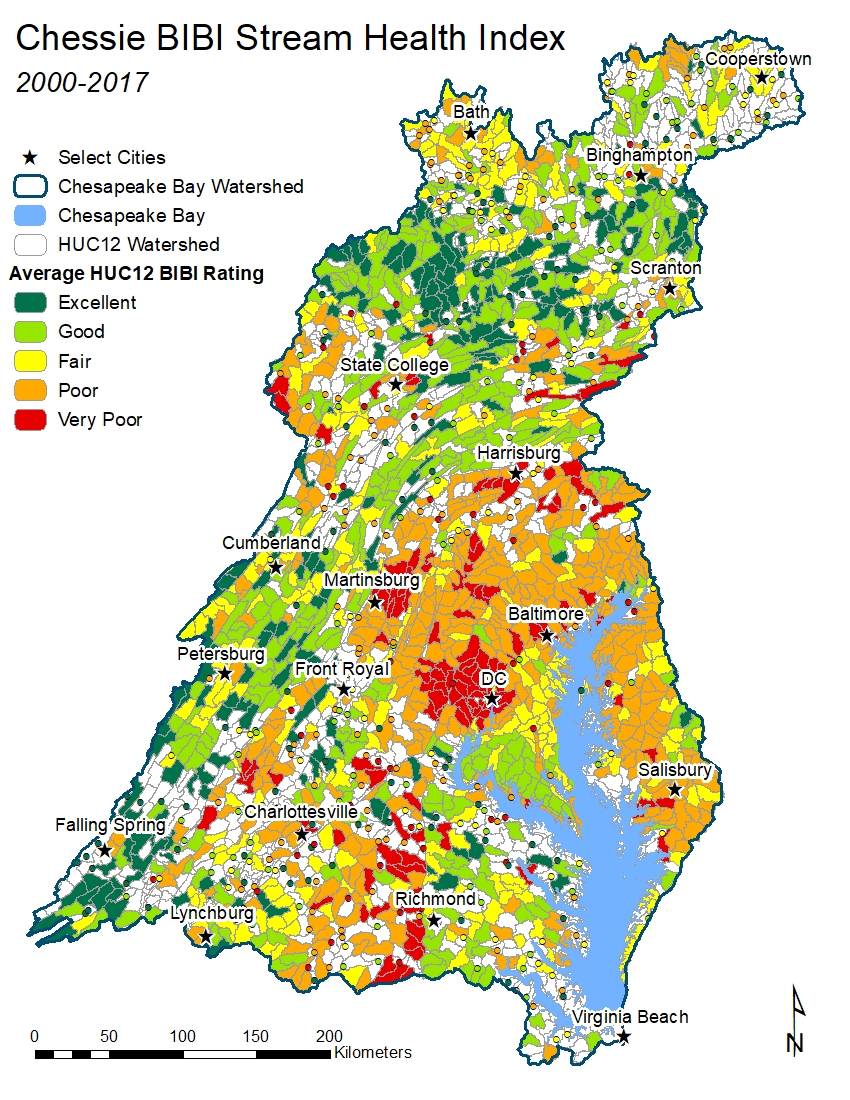 Turning the Chessie BIBI index into an effective management tool required decisions on when and how to use it. Scientists and managers addressed these issues at an April 2018 workshop. They agreed stream health would be measured basin-wide with the family-level, bioregion Chessie BIBI and selected the 6-year period between 2006 and 2011 as the most practical “2008 baseline” because it overlaps all the rotational sampling schedules of the state monitoring programs. Workshop participants agreed that model results could be used to fill in the gaps where observed data were not available.
Other needs were identified, including building consensus on what qualifies as 10% improvement, developing indicators of stream function to complement the Chessie BIBI, and using the CBP data protocols and Chesapeake Environmental Data Repository to merge stream datasets in the future.
What is the Baseline? Are Streams Improving?
In 2019, ICPRB tested several approaches for establishing the 2008 baseline. In 2023, the index was applied to an updated database containing more data for the 2006 – 2011 baseline period as well as the pre-baseline (2000 – 2005) and first interval after the baseline (2012-2017) periods. The ratings of the Chessie BIBI numeric scores were area-weighted to reduce bias caused by uneven sample densities and aggregated to the Chesapeake basin scale. The baseline was estimated to be 89,317 miles, or 61.7% of the watershed’s free-flowing stream miles. The percent of healthy stream miles in the Chesapeake watershed also appears to be increasing.
| Period | Estimated % Healthy Stream Miles |
| Pre-baseline (2000 – 2005) | 57.1% |
| Baseline (2006 – 2011) | 61.7% |
| First interval (2012 – 2017) | 67.8% |
White Paper (2019): Creating a Stream Health Baseline for the Chesapeake Basin from Monitoring and Model Data
Report to the CBP Stream Health Workgroup (2023): Stream Biological Health in the Chesapeake Bay Watershed
Building a Model
ICPRB is currently supporting USGS efforts to improve a predictive random forest model and run it with the recent data. The model uses landscape features (spatial location, bioregion, land cover, soil, precipitation, number of dams) to predict the Chessie BIBI rating on the small, EcoShed catchment spatial scale (~1.55 km2). Model runs indicate the Chessie BIBI index responds to different land uses, altered streamflow, and climate change.
More work is needed to refine the model as a management tool, but it should eventually be useful in addressing questions such as “Can restoration efforts improve stream health?” and “What efforts (e.g., protections, BMPs) are most effective for improving stream health?” For now, the monitoring results appear to be more than adequate in addressing the questions inherent in the stream health goal of the 2014 Chesapeake Bay Agreement: “Is stream health and function improving throughout the watershed?” and “What is the 2008 Baseline?”
Return to Aquatic Life Main Page