Potomac Basin Facts
Interstate Commission on the Potomac River Basin
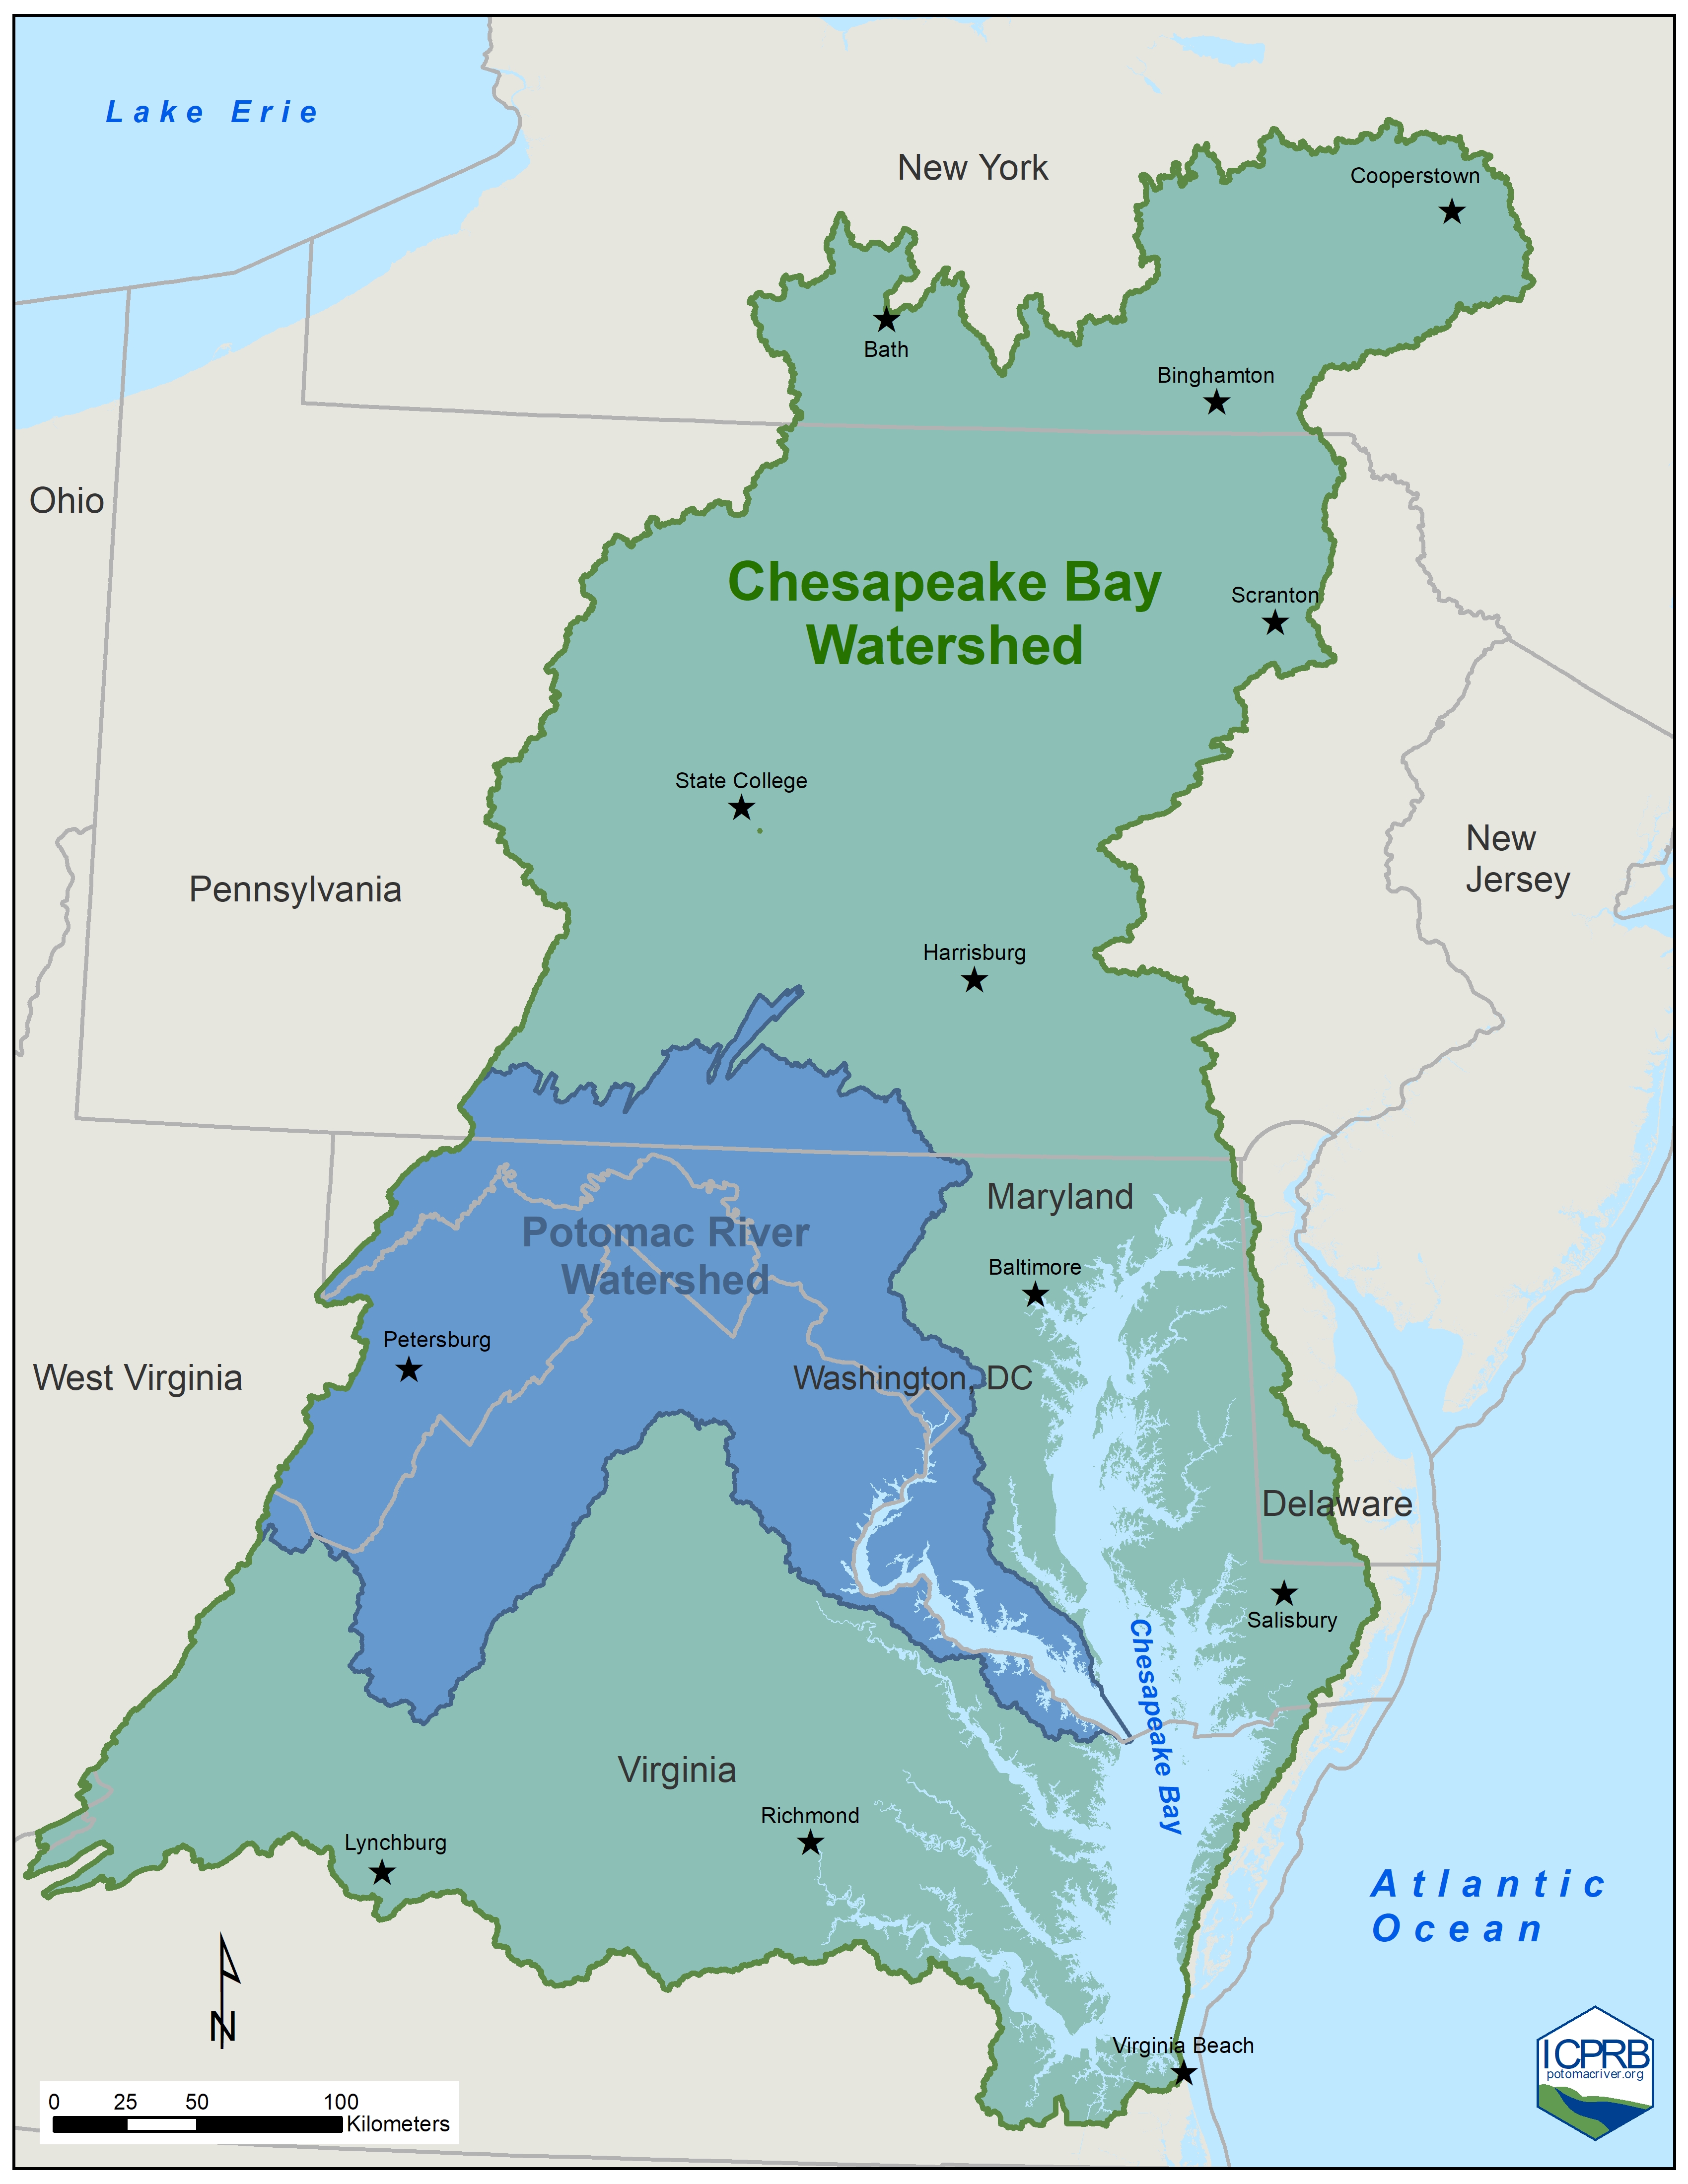
Potomac Basin within the Chesapeake Bay Watershed
The Potomac River is located in the east central part of the United States. The Potomac basin stretches across parts of four states (Maryland, Pennsylvania, Virginia and West Virginia) as well as the District of Columbia. This area is also called the Potomac watershed. It includes all of the land area where water drains towards the mouth of the Potomac – the point where the river spills into the Chesapeake Bay. The Potomac basin is the 2nd largest watershed in the Chesapeake Bay watershed.
The land of the Potomac basin varies a great deal from its sources to its mouth, and so do its people. It is difficult to fully describe the Potomac and its people because of their variety and because they are both constantly changing. With that in mind, here is a current snapshot of the basin’s land, its people, and its water.
Land
The drainage area of the Potomac includes 14,670 square miles in four states: Virginia (5,723 sq. mi.), Maryland (3,818 sq. mi.), West Virginia (3,490 sq. mi.), Pennsylvania (1,570 sq. mi.), and the District of Columbia (69 sq. mi.). The basin lies in five geological provinces: the Appalachian Plateau, the Ridge and Valley, Blue Ridge, Piedmont Plateau, and Coastal Plain. The Potomac meanders over 383 miles from Fairfax Stone, West Virginia to Point Lookout, Maryland. The river’s distance will vary with map projection and location of measuring tool in the river (i.e. middle of the river, Maryland shoreline, Virginia shoreline).
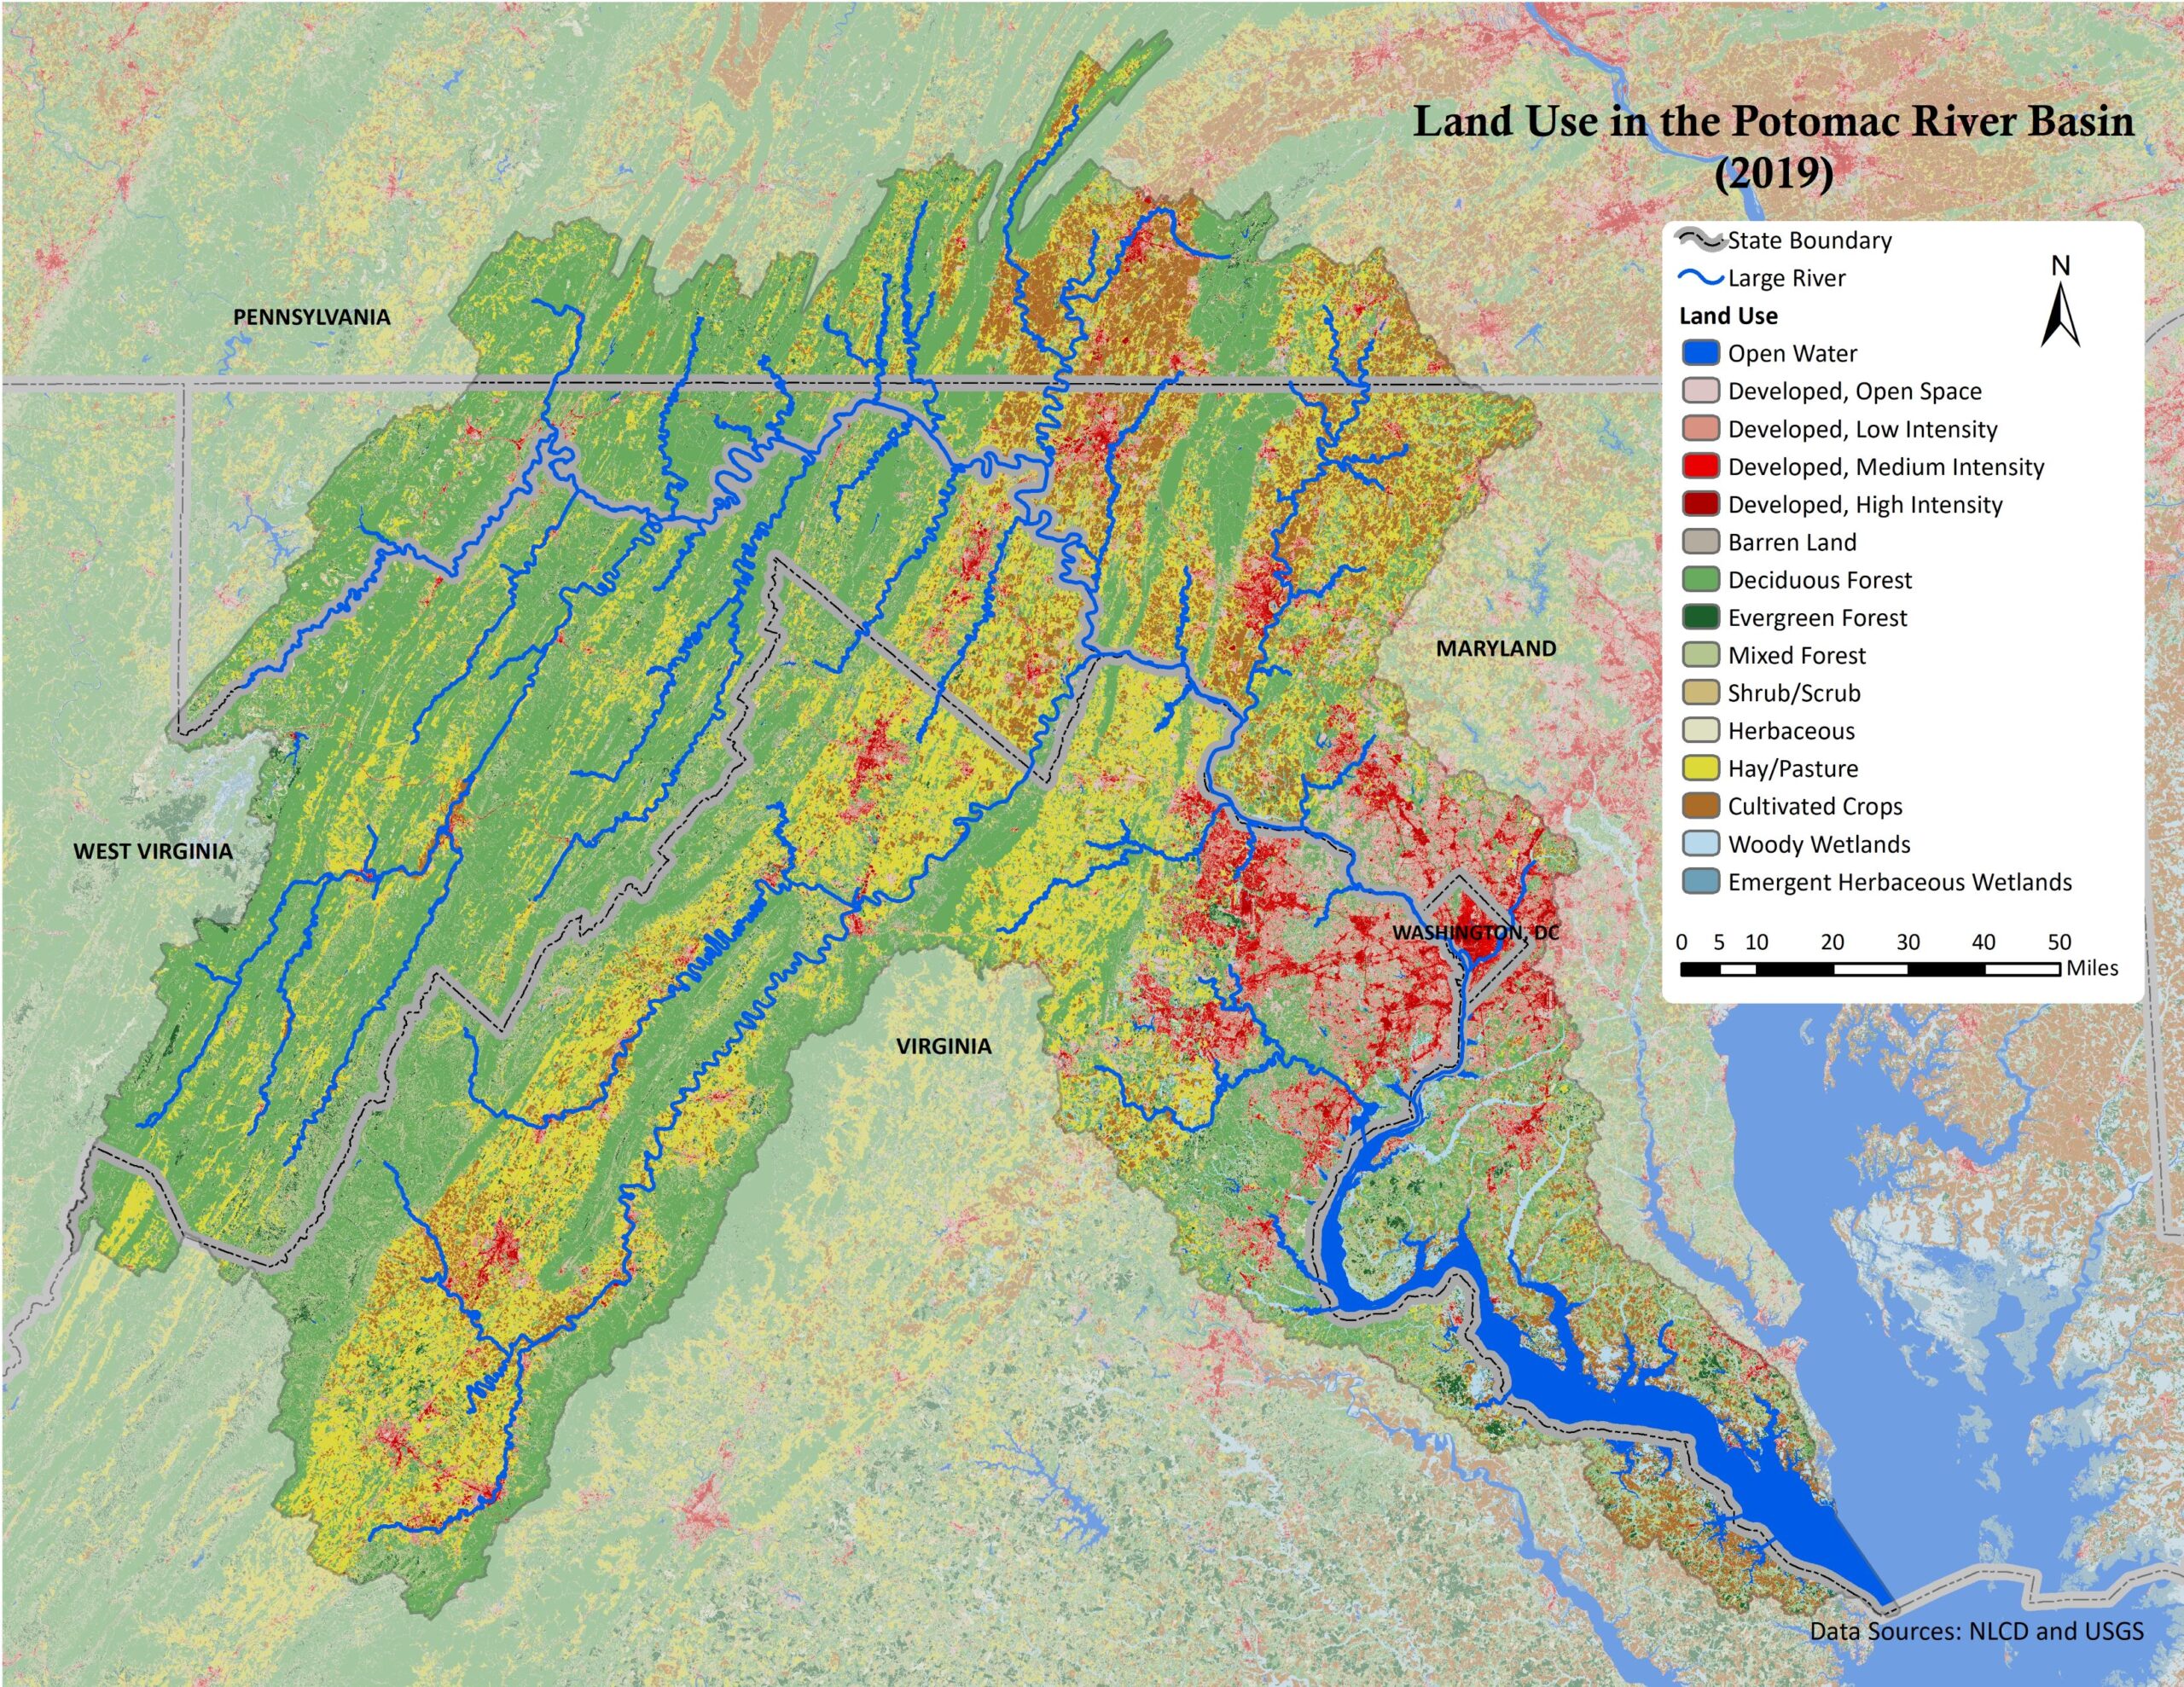
Land use in the Potomac basin (NLCD 2019).
Based on information from the 2019 National Land Cover Database (NLCD), the majority of the basin’s land area is covered by forests at 53.2 percent of the land area. This is a decrease of 3.7 percent since the 2001 NLCD data. Developed land makes up 14.7 percent of the basin’s land area, which is an increase of 20.2 percent since the 2001. Agriculture covers 25.2 percent. Water and wetlands make up 6 percent of the basin’s land area. The remaining 0.9 percent is barren or herbaceous landscapes.
The Potomac’s major tributaries include: the Anacostia River, Antietam Creek, the Cacapon River, Catoctin Creek, Conococheague Creek, the Monocacy River, the North Branch, the South Branch, the Occoquan River, the Savage River, the Seneca Creek, and the Shenandoah River. Visit our maps section to see these watersheds in detail.
The population of the basin is approximately 6.89 million (2020 estimated census). The population has increased by about thirteen percent since 2010. The following information is based on 2020 estimated census data.
People (source: 2020 census)
| Jurisdiction | Population in Basin by Jurisdiction | Population Density per Square Mile |
| Virginia | 3,239,702 | 568 |
| Maryland | 2,477,053 | 647 |
| West Virginia | 278,381 | 79 |
| Pennsylvania | 207,222 | 130 |
| Washington, D.C. | 689,545 | 10,089 |
| Total Basin Population | 6,891,903 | 469 |
The national average population density is 94 people per square mile. In the late 1500s, the average population density was 2.2 people per square mile. People living in urban areas account for the lion’s share of the basin’s residents at almost 81 percent of the population. Those living in rural areas make up 18.6 percent of the population, while those living on farms account for 0.7 percent. The Washington metropolitan area has approximately 5.1 million residents, or 84 percent, of the basin’s population (2010 census data).
Major cities in the Potomac basin include: Bethesda, Cumberland, Hagerstown, Frederick, Rockville, Waldorf, and St. Mary’s City in Maryland, Chambersburg and Gettysburg in Pennsylvania, Alexandria, Arlington, Harrisonburg, and Front Royal in Virginia, Harper’s Ferry, Charles Town, and Martinsburg in West Virginia, and the largest city in the basin, Washington, D.C.
The basin’s major industries include: agriculture and forestry throughout the basin, coal mining and pulp and paper production along the North Branch Potomac River; chemical production and agriculture in the Shenandoah Valley; high-tech, service, and light industry, as well as military and government installations in the Washington metropolitan area; and fishing in the lower Potomac estuary.
Water
 The largest flow ever recorded on the Potomac at Washington, D.C., was 275 billion gallons per day in March 1936. The lowest flow ever recorded at the same location was 388 million gallons per day in September 1966. The average flow at this location is about 7 billion gallons per day. These figures are all before water supply withdrawals.
History of the Fairfax Stone as a boundary marker of the Potomac basin.
Public water treatment plants treat approximately 83 percent of the basin’s wastewater. Another 16 percent is treated by private septic systems.An average of approximately 486 million gallons of water is withdrawn daily in the Washington area for water supply. Approximately 100 million gallons per day of groundwater used in rural areas. Almost 86 percent of the basin’s population receives its drinking water from public water suppliers while 13 percent uses well water.