CompPlanChallengeAreasandComm
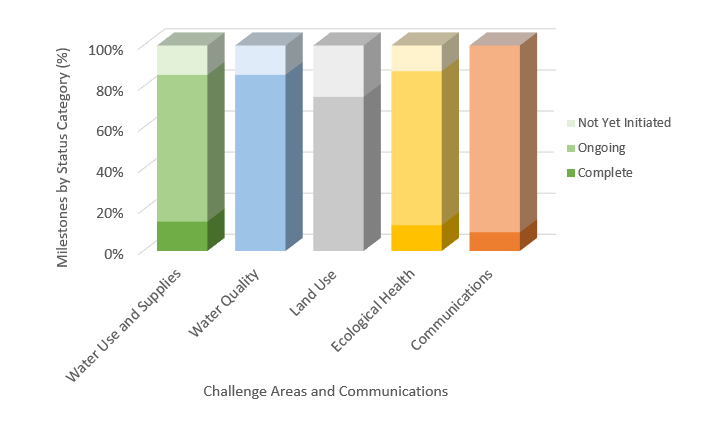
Figure 1. Year one implementation progress for short- and long-term milestones, 2019-2023. This figure does not illustrate percent complete by funding or staff time, only by the number of milestones in each status category. Challenge areas are distinguished by color. Status is designated using three shades of that color. The figure legend was developed using Water Use and Supplies as an example.
Comprehensive Plan Challenge Areas and Communication